振动测试
-
CoCo-80便携式测试系统在电力系统PSS试验中的应用
1 目的
随着电力系统规模的不断扩大和快速励磁系统的广泛采用,系统的正阻尼变弱,致使系统的联络线可能出现功率低频振荡。电力系统稳定器(PSS)就是专门用来增强系统正阻尼, 抑制系统低频功率振荡的功能模块,在大型发电机的励磁系统上已得到了广泛的应用,成为现代励磁调节器不可缺少的功能模块之一。
本应用由上海君协光电科技发展有限公司推广,使用其独家代理的美国晶钻仪器CoCo-80便携式动态信号分析仪,通过对发电机励磁调节器相频特性的测量及分析,确认PSS整定参数,验证PSS对抑制低频振荡的作用,使PSS具备投运条件。
2 依据
《同步发电机励磁系统技术技术条件》GB/T7409.3—1997;
《电力系统稳定器试验整定导则》Q/GDW143-2006;
电控励磁器相关技术资料。
3 所需测试仪器
CoCo-80便携式动态信号分析仪一台、WFLC录波仪一台、数字万用表一台。
4 应用项目
4.1励磁系统无补偿滞后相频特性测量
在励磁调节器屏的白噪声信号输入端子加入来自频谱分析仪输出的白噪声信号,使之进入励磁调节器;励磁调节器屏的电压端子引出机组电压至频谱分析仪作为白噪声扰动信号的响应信号。
从0V逐步增加输出白噪声信号的电平至发电机端电压有明显变化,用频谱分析仪测量发电机励磁系统滞后相频特性,同时记录包括发电机在内的励磁系统的相频特性数据。
4.2 PSS整定参数的计算
根据上面的相频特性测量结果,考虑电机振荡频率和本区域振荡频率两个相位补偿点,将PSS产生的附加电磁转矩相位整定在《导则》规定的范围之内(尽量靠在角速度轴上)。
4.3 发电机未投PSS时带负载的电压给定阶跃响应试验
4.3.1测量工况及励磁调节器运行方式要求
将在两个工况进行试验,分别是机组带80%和100%额定有功负荷,功率因素接近1,PSS退出运行,励磁调节器投“就地”控制方式。机组AGC、AVC退出运行。
4.3.2 试验过程
试验需要对发电机定子电压阶跃过程中有功和无功的变化过程进行录波。如果需要外接录波装置,则在将励磁调节器屏的电压(电流)端子引出至录波装置之前,必须测量电压(电流)录波回路不存在短路(开路)。
发电机定子电压阶跃值可考虑±2%,如果不能引起机组有功出力发生明显波动,可以将阶跃值取3%或4%。试验中记录发电机有功功率波动情况,以了解本机振荡特性。
4.4 PSS的投、切试验
在机组分别带80%、100%额定有功负荷及功率因素接近1的工况下,分别进行投入PSS和切除PSS的操作,观察被试机组有功、无功、定子电压等电气量应无明显扰动。
4.5 发电机投入PSS时带负载的电压给定阶跃响应试验
试验过程及要求同上,只是须投入PSS。
试验用于检查PSS阻尼功率振荡的效果,如果不满足《电力系统稳定器试验整定导则》有关要求,可根据情况重新调整PSS相位补偿整定参数和PSS放大倍数。
4.6 PSS反调试验
在机组带80%或100%额定有功负荷及功率因素且PSS投入的情况下,按照正常运行时机组允许的最快调节速度进行原动机功率调节(比如增加和减少各两兆瓦),观察发电机无功功率的波动,即反调情况。
4.7 PSS有补偿特性测试
该步试验用以验证PSS相位补偿参数的正确程度。将动态信号分析仪输出的白噪声加在PSS的电功率输入点,并将机端PT二次侧引入FLC,其接线方式与前一阶段的无补偿相频特性测试相同。
该试验需要现场的励磁调节器具备将白噪声加在电功率处的试验条件。
5 结论
之前,各省电科院、励磁厂商及电厂都使用某国际知名厂商的动态信号分析仪做PSS试验,但是由于该仪器为上世纪90年代产品,每通道切换采样,16位AD,动态范围低,体积大、重量重(达17公斤),携带不方便,数据导出比较麻烦,且维修难。使得试验效率低,测试精度不能满足现代测试分析要求。
-
NI中国区代理上海君协科技推出产品—Concord-9232 机器状态监测诊断系统
Concord-9232 机器状态监测诊断系统采用网络化实时数据处理技术、振动在线监测技术、轴功率实时监测技术、旋转机械故障诊断技术以及智能化专家系统。根据测点和信号类型的不同需求,使用LabVIEW软件平台、实时处理器、现场可编程门阵列(FPGA)等最新的虚拟仪器平台技术,灵活的构建分布式振动在线监测和故障诊断系统。系统通过下位机监测及超限报警程序将特征数据和原始数据等结果写进数据库中,以便系统使用由决策树和数据库进行故障诊断。

系统特点
1) 网络化实时数据处理技术
复杂耗时的数据采集和数据处理工作由监测装置完成,数据通过网络实时传送至上位机,使得上位机可以利用更多的资源进行数据显示、数据分析、故障诊断、结果打印等工作。
2) 机械故障监测及诊断
在机械设备上提供在线信号数据监测及诊断,保障机械设备安全运行,对传统利用机器相关工艺参数进行状态监测与故障诊断的方法提供有力补充和完善。
3) 智能化专家系统
采用智能化故障诊断专家系统,具有专业领域的工作经验、思想方法和知识积累,利用计算机的强大运算处理能力,形成高级的故障诊断知识库,提供参考价值很高的故障原因分析与相应的维修建议。通过对相关设备的在线监测,随时了解设备运行状态,发现设备其他监测报警装置不能反映的故障,如机械松动、不平衡、齿轮缺陷、皮带松动等,并明确故障的严重程度,做出故障的趋势分析。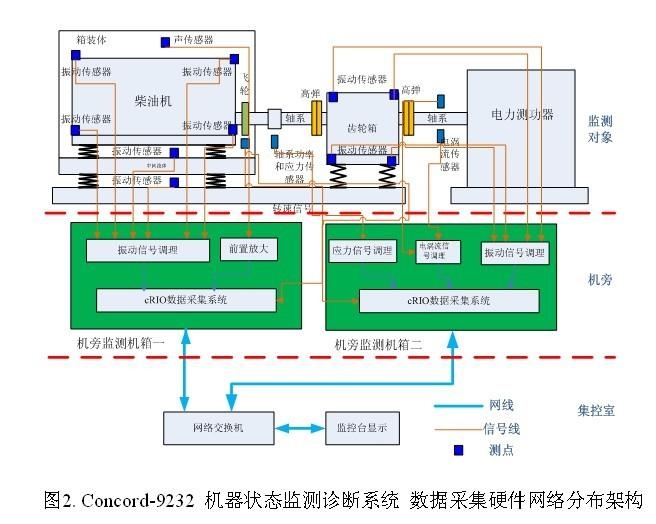 系统功能
系统功能
1)振动信号在线监测功能
2)轴系动态应变和轴功率在线监测功能
3)数据实时处理、分析和数据回放功能
其中,数据实时处理、分析和数据回放功能主要包含以下内容:
信号重采样: 完成各相关信号对转速信号的重采样,将等时信号转换为等角信号
常规显示: 各关键测量特征值的实时显示
波形分析: 信号时间波形及其幅值统计特征
相关分析: 信号自相关、互相关图
超限报警: 各通道分别配置三级阈值,超限自动报警并保存各通道波形数据
频谱及功率谱分析:信号频谱图、功率谱及频谱统计特征
瀑布图: 机组振动频谱图随时间变化趋势
阶次图: 轴系在启停机过程中各转速下各次谐波大小随转速的变化趋势
启停机特性图: 机组在启停机过程中通频或谐波幅值或相位随转速的变化
历史趋势图: 各参数随时间变化的趋势
报表及打印: 列表/图形显示或打印各种报表
回放/查询: 回放查询历史保存数据
4)安全阈值设置及报警功能
5)趋势分析及故障诊断功能
根据所选的时间范围,可查询和调取相关历史数据,进行特征值趋势显示和基于专家库的系统故障诊断,以统一的报表格式打印监测诊断结果。
系统具有基于振动信号的故障诊断知识库,基于决策树的专家系统原理,通过对设备状态异常原因和性质的分析,掌握其运行状态的变化情况、主要部件及子系统性能的劣化程度及发展趋势,为设备维修时间和方式的科学决策提供依据。可以诊断的典型故障类型如下:
发动机故障(累积样本后):整机异响、柴油机失火、气阀漏气故障,各缸发火不均、缸套拉伤、活塞环断裂等故障。
齿轮箱:不平衡、轴承损坏、轴承和支承激励振动、结构共振、齿轮啮合不佳;
轴系:不平衡、联轴器不对中、轴承损坏、轴承和支承激励振动、扭振振动。
6)数据采集设备技术指标
分析频率: 1Hz~23kHz;
信号输入: ±10V(通用电压信号);±5V(ICP振动信号);
测量通道: 28通道同步采样,抗混叠滤波 (可根据需求增加通道数量);
转换精度: 24位;
动态范围: 110 dB;
数据传输: 10/100M网络端口,可直接连入监测上位机;
供 电: AC 220V,不间断电源
7)环境
适应环境温度: 0~50℃倾斜和摇摆: 横倾 45°,纵倾 25°
相对湿度: 5%~95%耐盐雾、霉菌、油雾 -
Experimental Modal Analysis Overview
Experimental Modal Analysis (EMA) has developed into a major technology for the study of structural dynamics in the past several decades. Through Experimental Modal Analysis, complex structure phenomena in structural dynamics can be represented using decoupled modes consisting of natural frequency, damping, and mode shapes. The collection of these modal parameters is referred to as Modal Model. Experimental Modal Analysis is commonly referred to as Modal Analysis.
Structural vibration has been a significant focus for the dynamic testing and analysis group. Whether the object is a turbine blade rotating at high speed, or a bridge sustaining traffic and strong winds, Modal Analysis can be applied to provide insightful solutions.
Comprehensive Modal Analysis includes both data acquisition and the subsequent parameter identifications. From its inception till now, Modal Analysis has been widely applied in mechanical and structural engineering for designing, optimizing, and validating purposes. It has been widely accepted for broad applications in automotive, civil engineering, aerospace, power generation, musical instruments, (etc.), industries.
Experimental Modal Analysis emerged in the late 1950’s and gained steady popularity since the late 1960’s. During that time period, researchers tried to solve a major structural issue referred to as the self-excited aerodynamic flutter problem, which is considered a critical issue for the aerospace industry. Nowadays, ground vibration testing (GVT) is still carried out on the prototype of every new airplane model designed.
Another challenging task during that time period was normal mode tuning. A large amount of testing equipment was required in addition to the necessity of a highly skilled test team.
More commonly used than normal mode testing was the modal survey, which was conducted on a structure under test using a small hydraulic actuator or an electro-mechanical exciter to understand the characteristics of the structural modes. The measurement research effort of the late 1960’s and early 1970’s focused on generating a modal model from a set of measured FRFs.
Over the next several decades, the acquisition of FRFs followed by modal parameter identification based on FRF models proved to be the dominant methodology. Using this method, the FRFs are measured first, followed by parameter identification of the modal frequencies, damping factors and mode shapes.
The origin of modal analysis is traced back far into history. For instance, the Fourier series and the study of spectrum analysis laid a solid foundation for the development of modal analysis. Fourier, based on earlier mathematical wisdom, claimed that any arbitrary periodic function with a finite interval can always be represented by the summation of simple harmonic sinusoidal functions.
The Fast Fourier Transform (FFT) algorithm invented by James Cooly and John Tukey in 1965 paved the way for application of experimental techniques in structural dynamics. With FFT, Frequency Response Functions of a structure under test can be computed from the measurement of given inputs and resultant outputs. The modal analysis theory helps establish the relationship between measured FRFs and the modal data of the structure under test. Research efforts were focused on identifying modal data from measured FRF signals. Since then, numerous parameter identification methods have been proposed, from Single DOF to Multiple DOF, time domain methods to frequency domain methods, single reference to multiple reference, etc. Many of these methods have since been computerized, including methods based on responses of a structure instead of its frequency response functions.
Theoretical modal analysis is closely identified with the wave equation, which describes the dynamics of a vibrating string. From the solution, we can determine its natural frequencies and mode shapes. Forced responses can then be computed using the modal model. This stage of modal analysis, developed during the 1990’s, was largely dependent upon mathematics to solve partial differential equations which describe different continuous dynamic structures. The elegance of the solution is evident while the scope of the solvable structures is limited.
The concept of discretization of an object in space and the introduction of matrix analysis brought about a climax in analytical modal analysis. It was theorized that a structural dynamic analysis of an arbitrary system can be carried out when knowing its mass and stiffness distribution in matrix forms. However, this theory could only be realized when powerful computers became available. In this aspect, analytical modal analysis is very much a numerical method, which is one of the more popular Finite Element Analysis (FEA) applications.
Experimental modal analysis development also helped advance the theory of modal analysis. Traditional analytical modal analysis based on the proportional damping model was expanded into the non-proportional damping model. The theory of complex vibration modes was developed. Inverse structural dynamic problems such as force identification from measured responses were actively pursued. Nonlinear dynamic characteristics were studied experimentally.
Today, Experimental Modal Analysis has entered nearly all the fields of engineering and science. Its applications range from automotive engineering, aerospace engineering to bio-engineering, medicine and science. Analytical Modal Analysis (FEA dynamic analysis) and Experimental Modal Analysis have become part of the foundations of structural dynamics.
Modal testing is the experimental technique used to measure system characteristics, assuming the system is linear and time-invariant. The theoretical basis of this technique is secured upon establishing the relationship between the vibration response at one location and an excitation at the same or different location as a function of the excitation frequency. This relationship, which is often a complex mathematical function, is known as the Frequency Response Function or FRF in short. Combinations of the excitation and response at different locations lead to a complete set of frequency response functions (FRFs) which are collectively represented by an FRF matrix of the system. This matrix is usually symmetric, reflecting the structural reciprocity of the structure under test.
The practice of modal testing involves measuring the FRFs of a structure. The FRF measurement is simply taken by asserting a measured excitation force at one location of the structure in addition to measuring vibration responses at one or more location(s). The modern excitation technique and recent developments of modal analysis theory permit more complicated excitation mechanisms. The excitation can be of a selected frequency band, stepped sinusoid, transient, white noise, or periodic random types. It is usually measured by a force transducer or impedance head at the driving point while the response is measured by accelerometers or other probes. Both the excitation and response signals are fed into a dynamic signal analyzer which is an instrument responsible for computing the FRF data.
A practical consideration of modal testing is the quantity of FRF data needed to be acquired to adequately derive the modal model of the structure under test. When performing a simple hammer test, a fixed response location is used while alternately roving force excitation points. The measured FRF data constitutes a row of the FRF matrix. The data would theoretically suffice for deriving the modal model. For a simple shaker test, a fixed force input location is used while alternately moving response collection points or simultaneous acquiring responses from points. The measured FRF data constitutes a column of the FRF matrix. Again, the data should suffice theoretically. With sufficient measured FRF data, the parameter identification process will derive modal parameters by ways of curve fitting. This process is known as experimental modal analysis. The identified modal parameters will form the modal model of the structure under test. Parameters can be extracted either from individual FRF curves or from a set of FRF curves, namely a local or global method.
-
CoCo-80X: Designed for Usability
Today’s engineering tools are the result of constant software development, but these developments aren’t always best for the end-user. Engineers who are heavily invested in their tools will be reluctant to switch to a new device. In a time where software is constantly changing, people don’t have the time to struggle with new software interfaces. Especially field technicians, whose job is to collect and analyze data, don’t like wasting time getting used to a new software interface. Their job is already complicated, and is only made worse with a complicated measurement device. If their tools are too complicated to use, engineers will look for a simpler solution.
This is one of the great advantages of the CoCo-80X – the minimalistic interface and simple controls are welcoming to users. The signal display conveys only the most necessary information, while advanced features are also immediately available through touchscreen controls and function keys. Users can quickly add or remove signals to any plot, and can also configure the X- and Y-axes via the touchscreen.
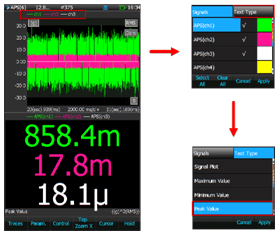
Figure 1: Switching to a Numeric Display
The CoCo-80X’s most common and important features are immediately accessible through dedicated hotkeys. The analyzer’s primary setup menus can be accessed from any menu, so users can quickly navigate to any menu interface. These powerful and intuitive controls are what make the CoCo-80X such an appealing proposition.
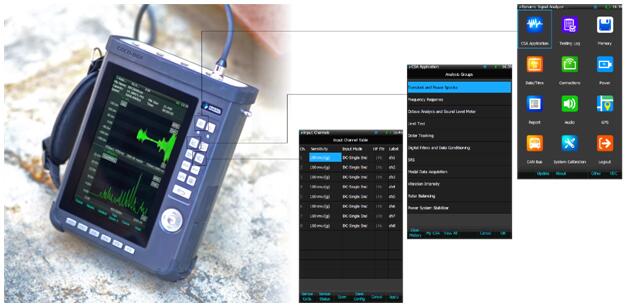
Although new users will appreciate this level of accessibility, there are also many features tailored to experienced users. The CoCo-80X handles analysis functions through a system called Configurable Signal Analysis (CSA), which allows users to easily manage their analysis projects through a simple interface. Since all settings are uniquely saved to individual projects, users only need to configure their project once. This means users can quickly pause and resume their tests without reconfiguring any parameters – which is a huge benefit for routine users.
The CoCo-80X is a powerful solution for many applications, but it’s the intuitive design and high level of accessibility that provide a truly unmatched experience. The CoCo-80X also boasts a hardware upgrade, which is immediately noticeable in the faster boot-up and zippy interface. These improvements have removed much of the friction involved in data acquisition, so technicians can spend less time acquiring data and more time analyzing data.


